 Docs
Docs
Investigate
Guided investigations run a chosen workflow against one indicator and hand back a clear picture of what it is and what it connects to.
1 · Pick your investigations
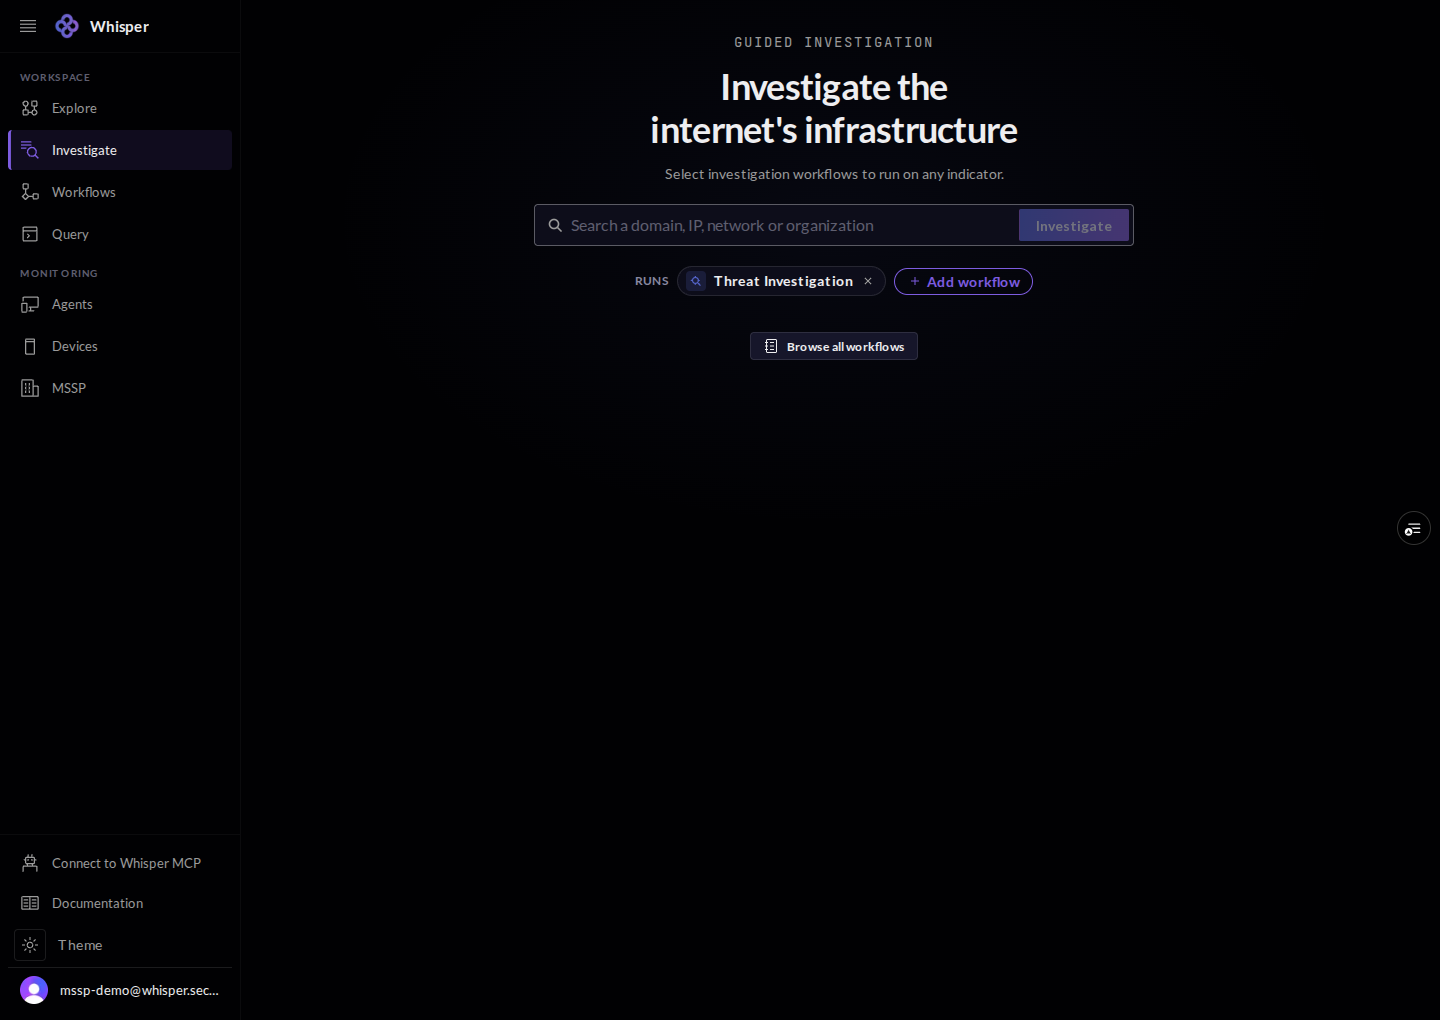
Start on the launcher. Choose one or more investigation workflows to run, then point them at any indicator. Browse the full set from Workflows.
2 · Give it an indicator
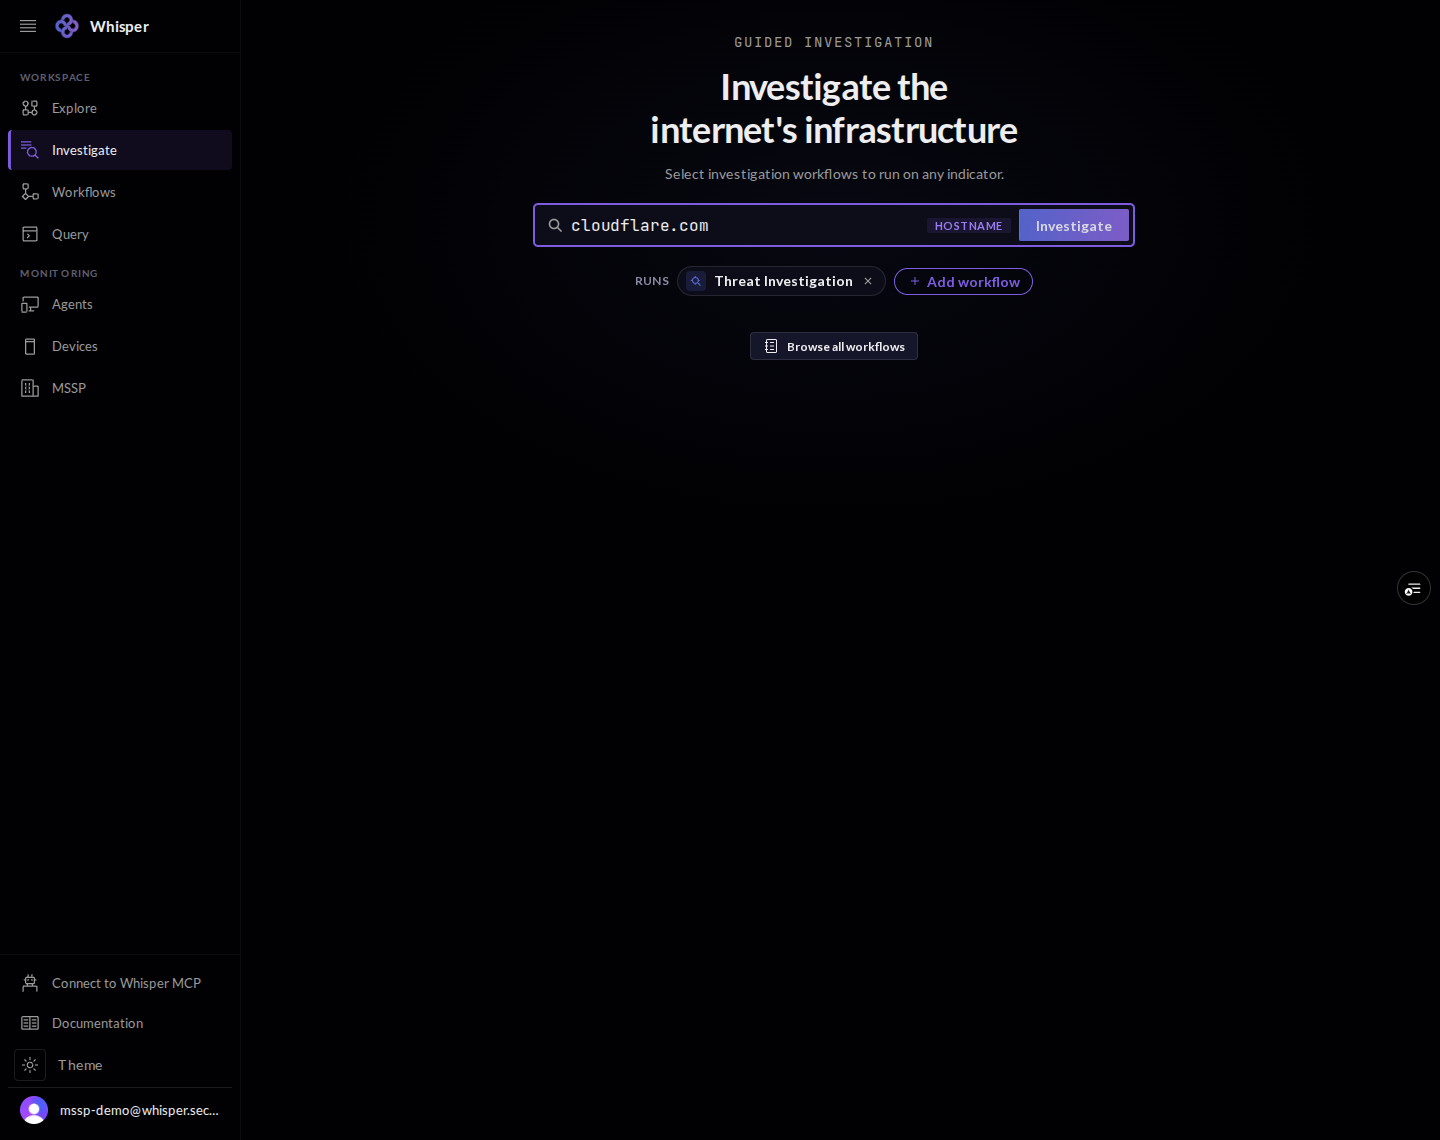
Type a domain, IP, network, or organization. The console detects the indicator type as you go, so the right checks run against it.
3 · Run a workflow
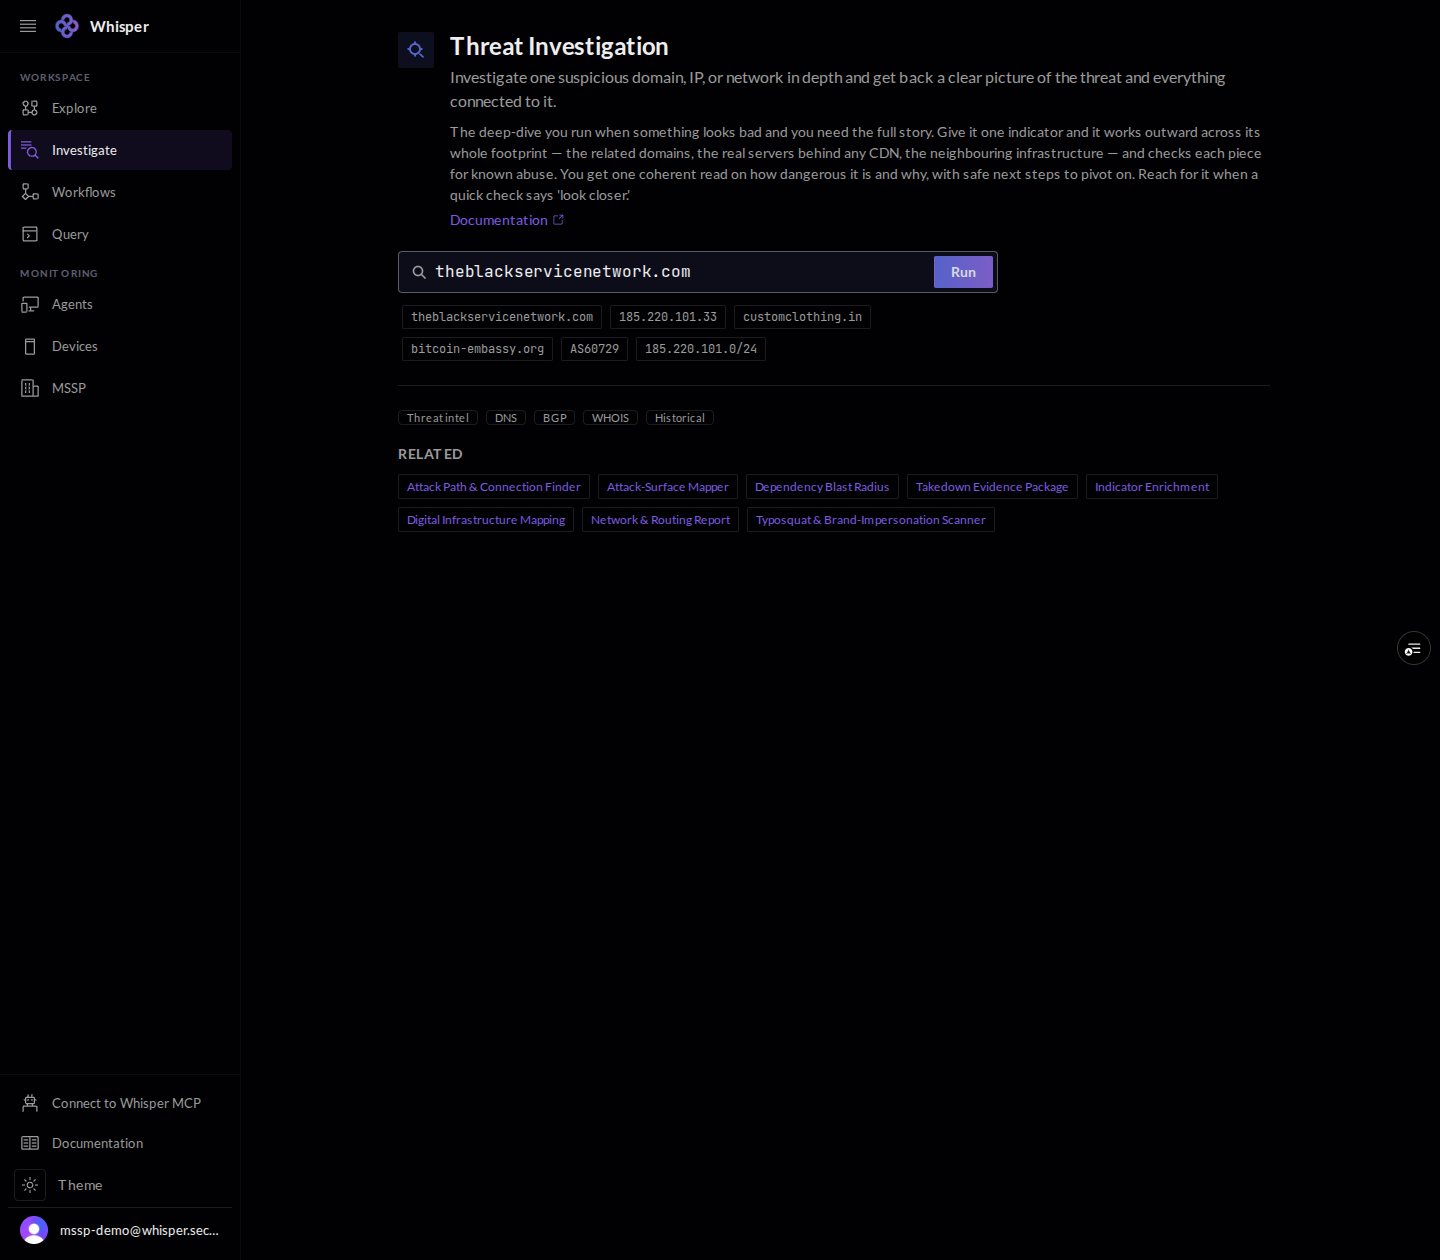
Each workflow opens with a plain description of what it does, a few sample indicators to try, category filters, and a list of related workflows to pivot into. Press Run to execute it against your indicator.